Scatter Plot Worksheets
Create fresh scatter plot worksheets with a reproducible question set, downloadable practice pages and separate answer keys.
Scatter Plot Worksheets
Practice worksheet · Sheet ID 20261104
How to use this worksheet
- Read every coordinate pair (x, y).
- Look for an overall upward, downward or absent trend as x increases.
- Base the answer on the pattern of all points, not one pair.
Refresh the seed to generate another distinct set. For review, download the separate answer PDF instead of printing answers over the questions. Worked steps are available only on step-verified topics.
Example printable practice
A fixed-seed preview created from the same deterministic generator used above.
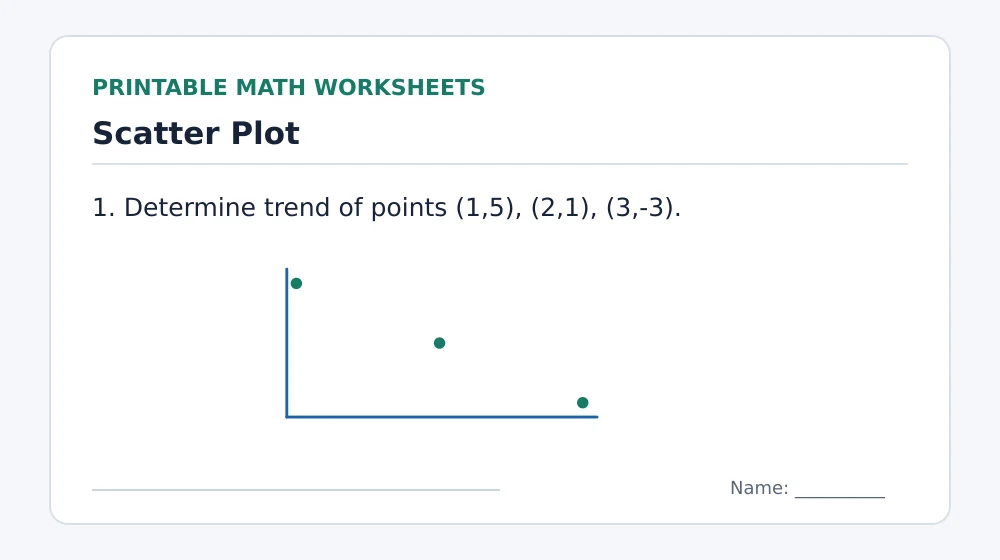
Worked example
Question: Determine trend of points (1,5), (2,1), (3,-3).
Answer: negative
- Compare x with y values
- As x increases, y decreases
This example is generated from a fixed seed so the explanation and answer refer to the exact same mathematical problem.
Teaching notes
The generator offers Easy, Standard and Challenge numerical ranges. These are practice settings, not school curriculum levels or official assessment standards.
For fractions, compare simplified exact answers; for statistics, use the stated median-of-halves quartile rule; for geometry, keep the dimensions and units consistent.
Always review the printed answer key before distributing worksheets to a classroom.
Common mistakes
- Confusing the x and y positions on a coordinate grid.
- Treating a pattern as necessarily causal.
Check your answers
The answer-key PDF is generated from the same exact problem set and seed as the practice sheet. Use it after attempting each question. You can reproduce the sheet later using the same topic, difficulty, question count and seed.
For printing, select US Letter or A4; for a physical protractor, always use 100% scale and verify the 50 mm line.